Ask Questions.
Get Instant Dashboards.
Connect your WMS databases and transform operational data into real-time, AI-powered dashboards. Across every warehouse, every site, every client. No SQL. No coding. No waiting.

Widget Creation to Dashboard
This document explains the end-to-end flow of creating widgets, generating charts, and building dashboards in the WMS platform. It covers every step a user goes through, from asking a question in natural language to seeing a live widget on their dashboard.
Unlimited Supports
What you need
We've 10+ high expert
Team members
Few steps to write content
Let our AI assist with most time consuming to write blog articles, product descriptions and more.
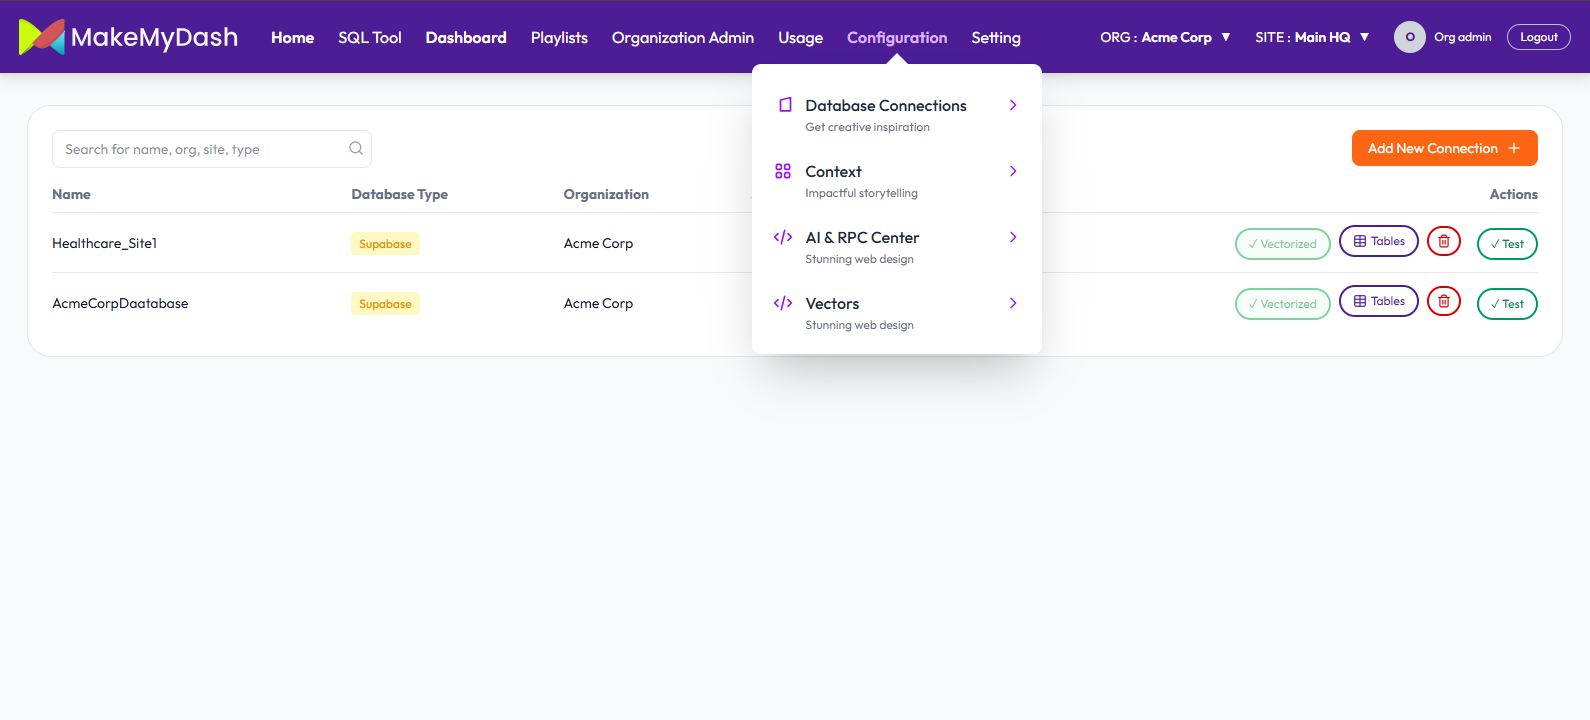
01. Create Database Connection
Click Configuration -> Database connections -> Add New Connection
Fill out the form and click Save Connection Button.
Portfolio
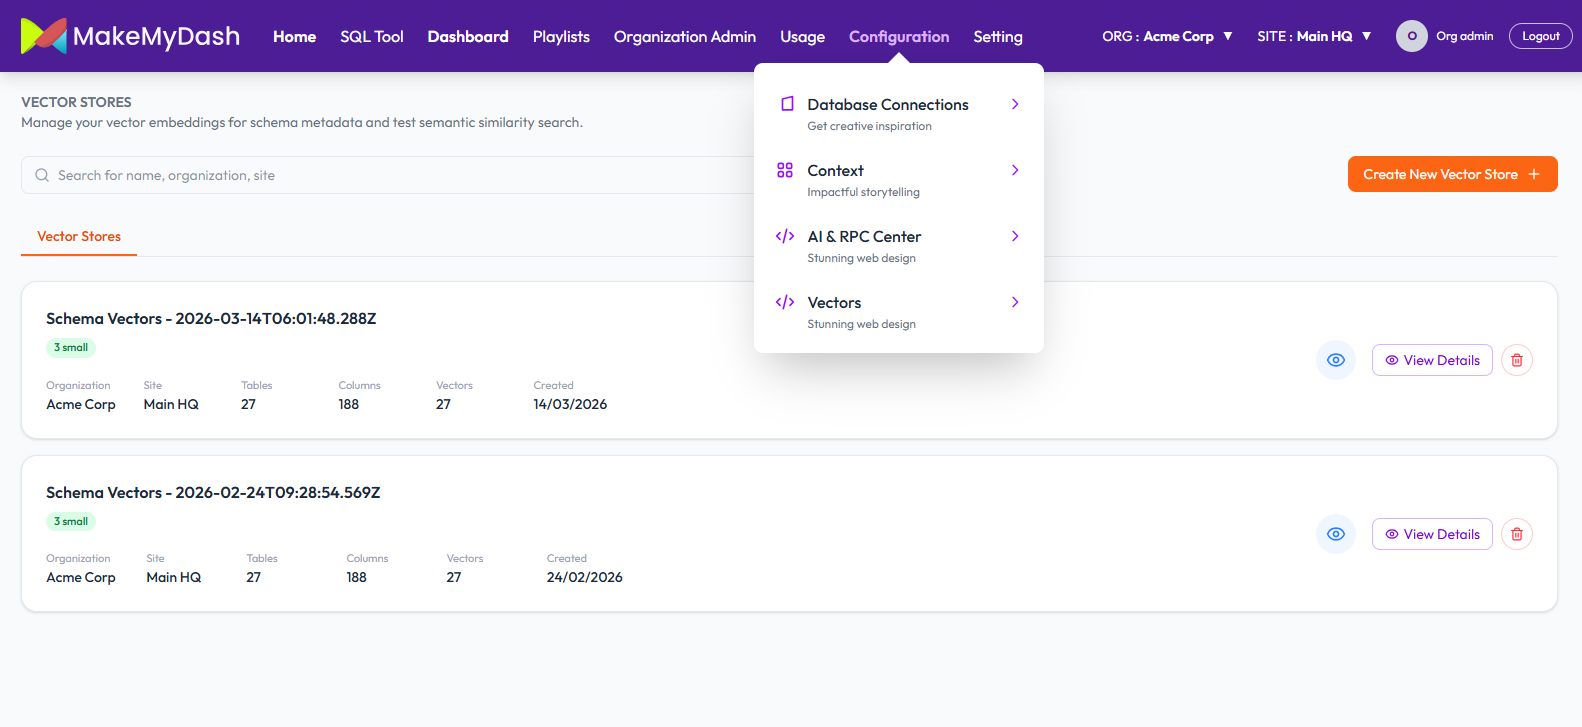
02. Create Vector store for your Database
MakeMyDash creates an intelligent index called “Vector Store” of the database structure
Click Configuration -> Vectors -> Create New Vector store Fill out the required fields (Store Name, Organizations, Site and select Database Connections).
Click Create Vector Store button to save the data.
We will able to see our newly created vector store.
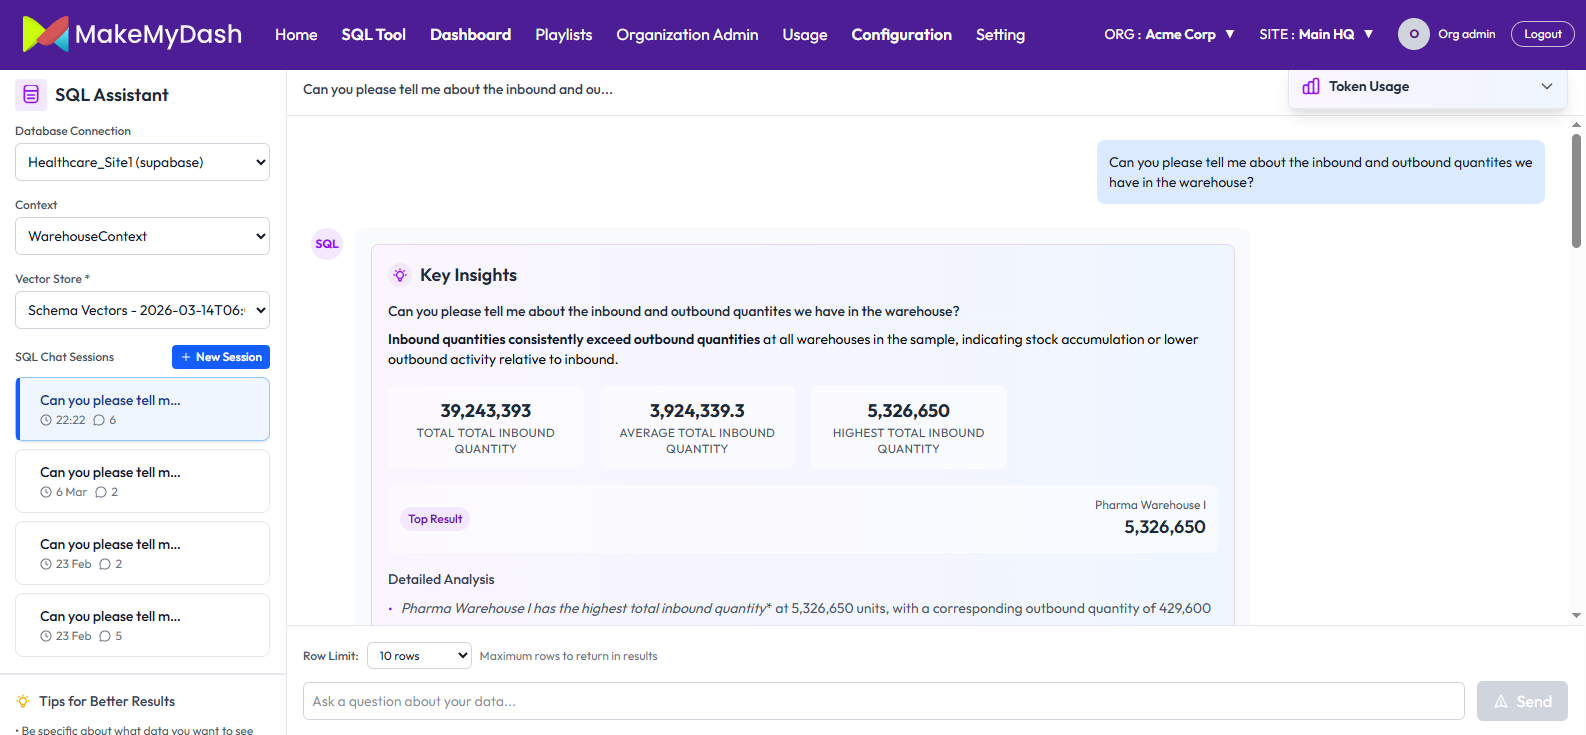
03. Natural Language Querying
User’s type questions in plain English and AI converts this into a database query, run it and returns answer instantly.
Click SQL Tool tab. Select your database connection, Context, and Vector store (that we created above).
Ask any query related to your data to AI, it will give you answer instantly with detailed Analysis.
You can also check detailed steps by clicking View Detailed Steps at the bottom of the result.
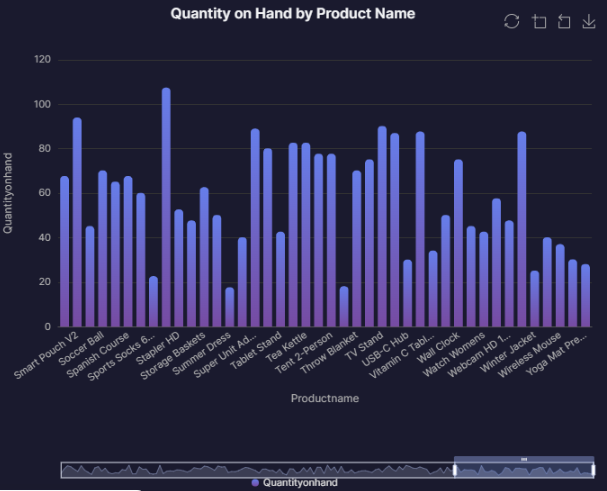
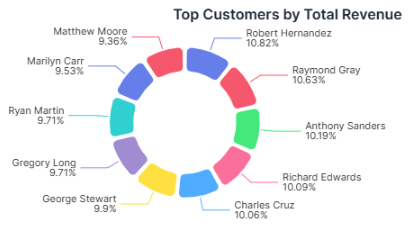
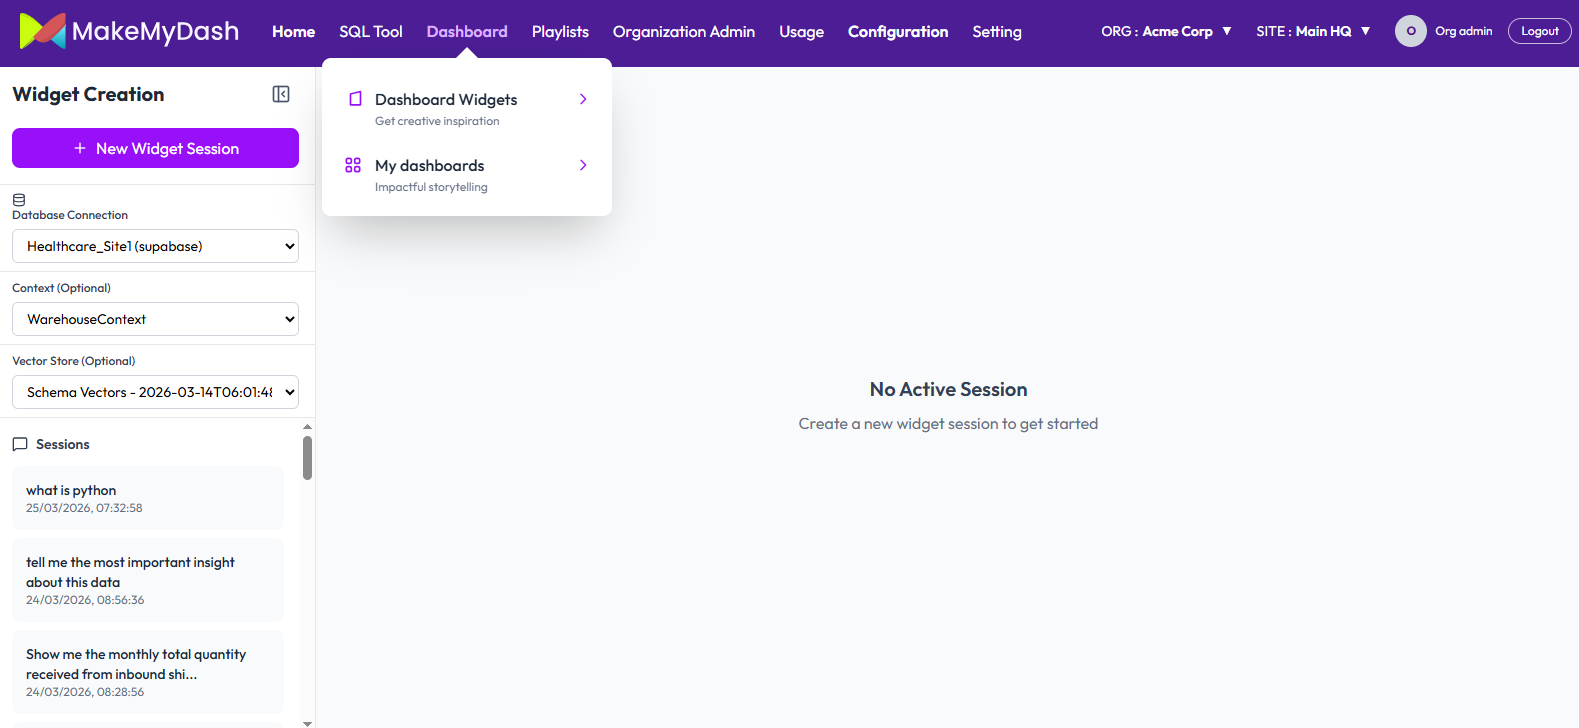
04. Chart and Dashboard Creation
Transform your query result into chart. Charts are saved as widgets & arranged into dashboards
Go to Dashboard -> Dashboard Widgets.
Select your Database connection, Context, and Vector store. Ask your question about data and click Sent button.
Click on Explore in Data Panel -> Transform button to convert your result table into graph.
On Create Visualization select any option from suggestion group and any prompt from Quick Start Prompt. Modify the prompt as per your choice and click Generate Chart button.
You can again modify your query and generate chart as per your choice and save Widget.
Go to Dashboard -> My Dashboard -> Add Widgets
Select your widgets and click Add Selections button.
Show all your data in graphical form on Dashboard.
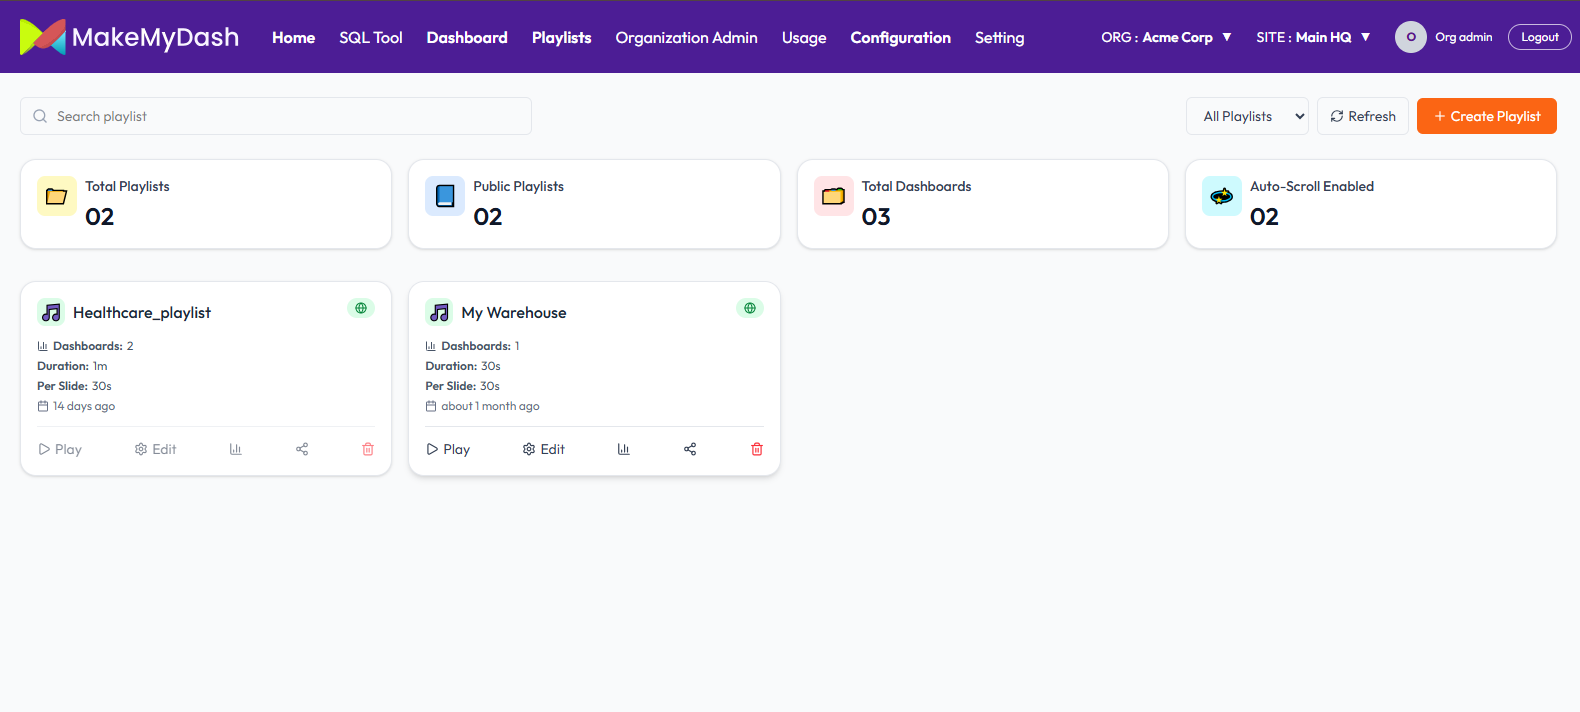
05. Sharing via Playlists
Share your Dashboard in the form of Playlist that auto-rotate on TV Screen, or shared via link.
Click Playlist -> Create Playlist
Provide the required information and click on create playlist. You can make your Playlist public as well.
Then add your newly or existing Dashboard to your playlist.
Click Play button of your playlist to share or see your own data in graphical form or the way you want to see.
Connect with us for next
Gen Business Success
Send us a Message

Email us anytime
mahek.shah@makemydash.com